
Ad spend in Japan in 2022 – Knowledge & Data

Total advertising spending in Japan in 2022
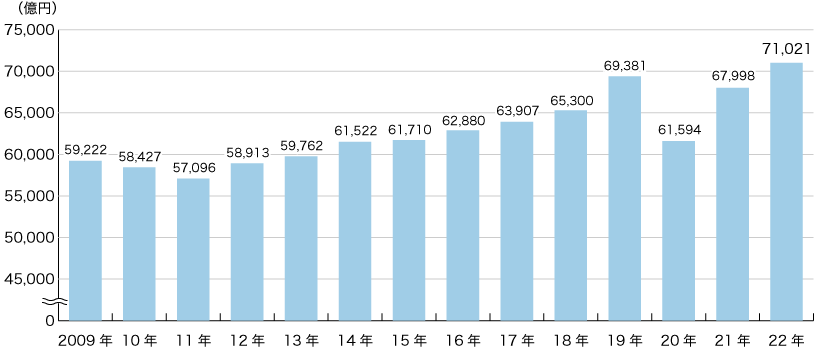
- Japan’s total advertising expenditure reached a record high of 7,102.1 billion yen (104.4% year-on-year)
- Robust “Internet advertising spending” surpassed 3 trillion yen, continuing to support the growth of the overall advertising market
- “TV media-related video ads” increased by 140.6% year-on-year
Characteristics of Japanese advertising spending in 2022
- Total advertising spending in 2022 was 7,102.1 billion yen (104.4% year-on-year) for the full year (January-December quarter).It surpassed 2019 before the corona disaster and became the highest ever since the estimation started in 1947*. The first half of the year was strong due to the easing of restrictions on movement following the recovery from the coronavirus pandemic and the impact of the Beijing 2022 Winter Olympics and Paralympics. In the second half of the fiscal year, despite the impact of major changes in the economic environment due to the situation in Ukraine and changes in monetary policies in Europe and the United States, as well as the re-expansion of the new coronavirus infection (hereafter referred to as “new corona”), there was a gradual recovery in social and economic activities. As a result, demand for advertising has increased, centering on “restaurants/various services” and “transportation/leisure.” In particular, against the backdrop of the digitalization of society, the overall advertising market has grown due to strong internet advertising spending.
*The previous year’s record high was in 2007 (7,019.1 billion yen). - Internet advertising expenditure was 3.0912 trillion yen (114.3% of the previous year), an increase of approximately 1 trillion yen in just three years from 2019 when it exceeded 2 trillion yen. Demand for video advertising, centered on in-stream advertising, continued to rise from the previous year, and the expansion of digital promotions also contributed to market growth. Gross advertising spending increased in 2022 due to strong Internet advertising spending.
- Of the advertising expenses (TV media digital) for Internet media services mainly provided by television media broadcasters, the estimated scope is advertising expenses for Internet video distribution such as missed TV programs and real-time distribution services. TV media-related video advertising expenses” showed a high growth of 35 billion yen (140.6% compared to the previous year). Connected TV*Advertising demand increased due to the expansion of the use of , and program content including originals with high planning and editing capabilities such as large-scale sports broadcasts and topical dramas.
* A TV terminal connected to the Internet line.
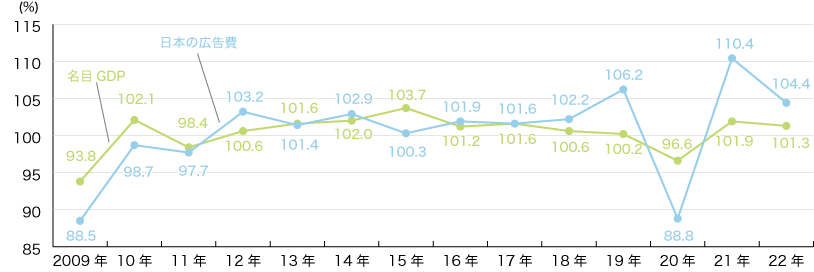
(1) Japan’s total advertising expenditure and nominal gross domestic product (GDP)
| advertising costs in japan | Nominal gross domestic product (GDP) | to nominal gross domestic product Ratio of advertising expenses in Japan (%) |
|||
|---|---|---|---|---|---|
| (billion yen) | YoY change (%) | (billion yen) | YoY change (%) | ||
| 2009 | 59,222 | 88.5 | 4,949,384 | 93.8 | 1.20 |
| 10 years | 58,427 | 98.7 | 5,055,306 | 102.1 | 1.16 |
| 11 years | 57,096 | 97.7 | 4,974,489 | 98.4 | 1.15 |
| 12 years | 58,913 | 103.2 | 5,004,747 | 100.6 | 1.18 |
| 13 years | 59,762 | 101.4 | 5,087,006 | 101.6 | 1.17 |
| 14 years | 61,522 | 102.9 | 5,188,110 | 102.0 | 1.19 |
| 15 years | 61,710 | 100.3 | 5,380,323 | 103.7 | 1.15 |
| 16 years | 62,880 | 101.9 | 5,443,646 | 101.2 | 1.16 |
| 17 years | 63,907 | 101.6 | 5,530,730 | 101.6 | 1.16 |
| 18 years | 65,300 | 102.2 | 5,566,301 | 100.6 | 1.17 |
| 19 years | 69,381 | 106.2 | 5,579,108 | 100.2 | 1.24 |
| 20 years | 61,594 | 88.8 | 5,390,824 | 96.6 | 1.14 |
| 21 years | 67,998 | 110.4 | 5,493,793 | 101.9 | 1.24 |
| 22 years | 71,021 | 104.4 | 5,565,440 | 101.3 | 1.28 |
(Note) Nominal Gross Domestic Product (GDP) is based on the Cabinet Office’s “Final Report on National Accounts” and “Preliminary Report on GDP by Quarterly” (published on February 14, 2023, first preliminary report).
(2) Changes in total advertising expenditure and nominal gross domestic product (GDP) in Japan
(3) Advertising expenditure in Japan (Year-on-Year change by medium)
| total ad spend | Year-on-year change by medium (%) | |||||||||
|---|---|---|---|---|---|---|---|---|---|---|
| Amount of money (billion yen) |
year-on-year (%) |
mass media four media |
satellite media connection |
the internet | promotion media |
|||||
| newspaper | magazine | radio | Terrestrial tv set |
|||||||
| 2009 | 59,222 | 88.5 | 85.7 | 81.4 | 74.4 | 88.4 | 89.8 | 104.9 | 101.2 | 88.2 |
| 10 years | 58,427 | 98.7 | 98.1 | 94.9 | 90.1 | 94.8 | 101.1 | 110.6 | 109.6 | 95.6 |
| 11 years | 57,096 | 97.7 | 97.4 | 93.7 | 93.0 | 96.0 | 99.5 | 113.6 | 104.1 | 95.4 |
| 12 years | 58,913 | 103.2 | 102.9 | 104.2 | 100.4 | 99.9 | 103.0 | 113.7 | 107.7 | 101.4 |
| 13 years | 59,762 | 101.4 | 100.1 | 98.8 | 98.0 | 99.8 | 100.9 | 109.6 | 108.1 | 100.1 |
| total ad spend | Year-on-year change by medium (%) | ||||||||||
|---|---|---|---|---|---|---|---|---|---|---|---|
| Amount of money (billion yen) |
year-on-year (%) |
mass media Four media* |
Inter Net |
promotion media |
|||||||
| newspaper | magazine | radio | tv set media |
||||||||
| Terrestrial tv set |
satellite media connection |
||||||||||
| 2014 | 61,522 | 102.9 | 101.6 | 98.2 | 100.0 | 102.3 | 102.8 | 102.4 | 109.6 | 112.1 | 100.8 |
| 15 years | 61,710 | 100.3 | 97.6 | 93.8 | 97.7 | 98.6 | 98.8 | 98.6 | 101.5 | 110.2 | 99.1 |
| 16 years | 62,880 | 101.9 | 99.6 | 95.6 | 91.0 | 102.5 | 101.7 | 101.6 | 103.9 | 113.0 | 98.9 |
| 17 years | 63,907 | 101.6 | 97.7 | 94.8 | 91.0 | 100.4 | 99.1 | 98.9 | 101.3 | 115.2 | 98.5 |
| 18 years | 65,300 | 102.2 | 96.7 | 92.9 | 91.0 | 99.1 | 98.2 | 98.2 | 98.1 | 116.5 | 99.1 |
| 19 years | 69,381 | 106.2 | 96.6 | 95.0 | 91.0 | 98.6 | 97.3 | 97.2 | 99.4 | 119.7 | 107.5 |
| 20 years | 61,594 | 88.8 | 86.4 | 81.1 | 73.0 | 84.6 | 89.0 | 88.7 | 92.6 | 105.9 | 75.4 |
| 21 years | 67,998 | 110.4 | 108.9 | 103.4 | 100.1 | 103.8 | 111.1 | 111.7 | 103.1 | 121.4 | 97.9 |
| 22 years | 71,021 | 104.4 | 97.7 (23,985) |
96.9 (3,697) |
93.1 (1,140) |
102.1 (1,129) |
98.0 (18,019) |
97.6 (16,768) |
103.5 (1,251) |
114.3 (30,912) |
98.3 (16,124) |
(Note) Figures in parentheses for 2022 are advertising expenses (100 million yen)
(Note) From 2014, TV media advertising expenses were categorized as “terrestrial TV + satellite media-related” and aggregated retroactively to 2012.
(Note) From 2019, “advertising expenses for product sales EC platform” will be added to “Internet advertising expenses”, and “events” will be added to “exhibitions, videos, etc.”.
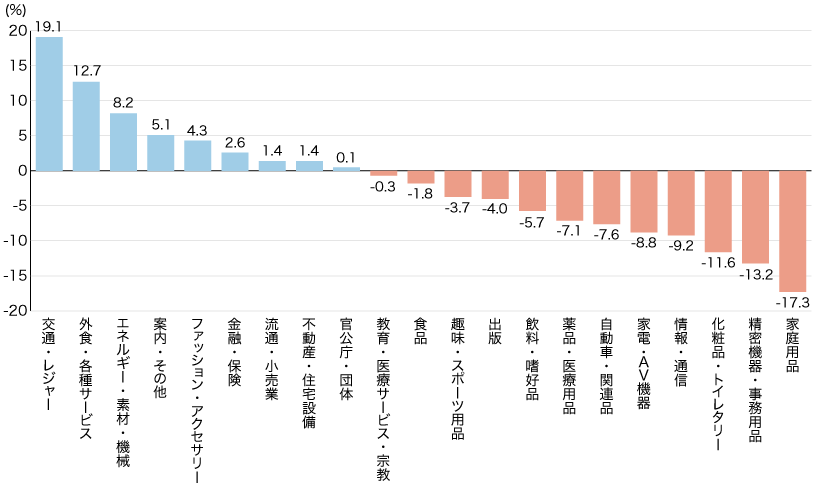
(4) 2022 advertising expenditure growth rate for four media in 21 industries
*Excluding satellite media-related